ConfigMgr 1906 introduces the ability to run a task sequence in debug mode. This cool feature allows you to skip through the task sequence as it runs and test steps and debug. You have to run the debug tool on a targeted device as it not a remote tool. Plus, you need to have some prerequisites in place. Once set up, it’s an awesome timesaver when you want to get to the heart of the problem.
The prerequisites for the debugger are as follows:
- The debug tool is a pre-release feature so you must switch this on via Administration\Updates and Servicing\Features. This is assuming you have allowed the use of pre-release on your hierarchy – check Administration\Site Configuration\Sites, in the ribbon select Hierarchy Settings and in General tab enable Consent to use pre-release features.
- The targeted device must be running at least the ConfigMgr 1906 client, so update this on the client if it’s not.
- The debug tool only runs if the logged in user is a local administrator.
- Ensure that your boot image is running the latest client version. You can view this in Software Library\Overview\Operating Systems\Boot Images. Check the Client Version column for your boot images.
With the prereqs in place, you can begin to debug your task sequences. For the task sequence you wish to debug, you need to target this at a small collection. Microsoft states that the debug deployment only displays collections with 10 or less members, so bear this in mind. You can set a collection variable called TSDebugMode to True on your collection so that any task sequence deployed will automatically be assigned in debug mode. Alternatively, you can right-click your task sequence and choose Debug.
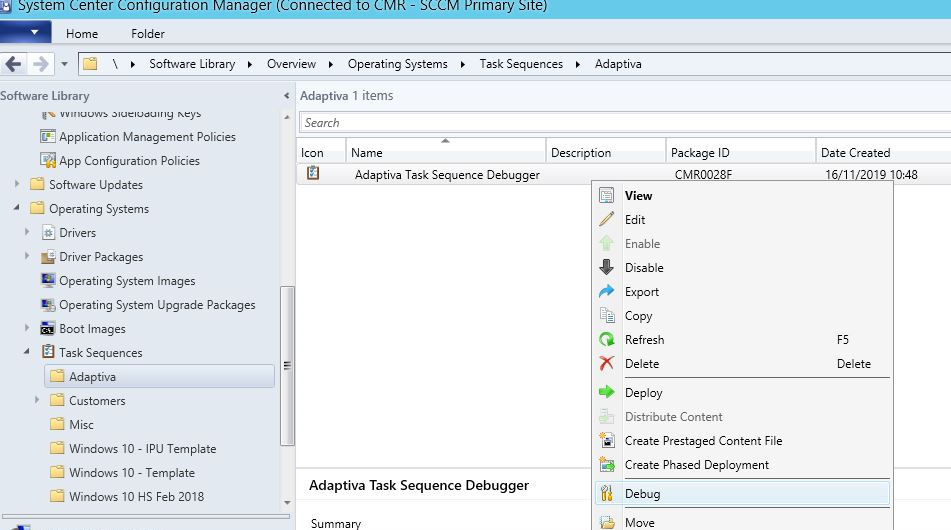
The Debug task sequence wizard is no different to deploying a normal task sequence. Note, however, that a debug task sequence can only be made Available to the targeted devices.
When deployed, Software Center will display the task sequence as normal.
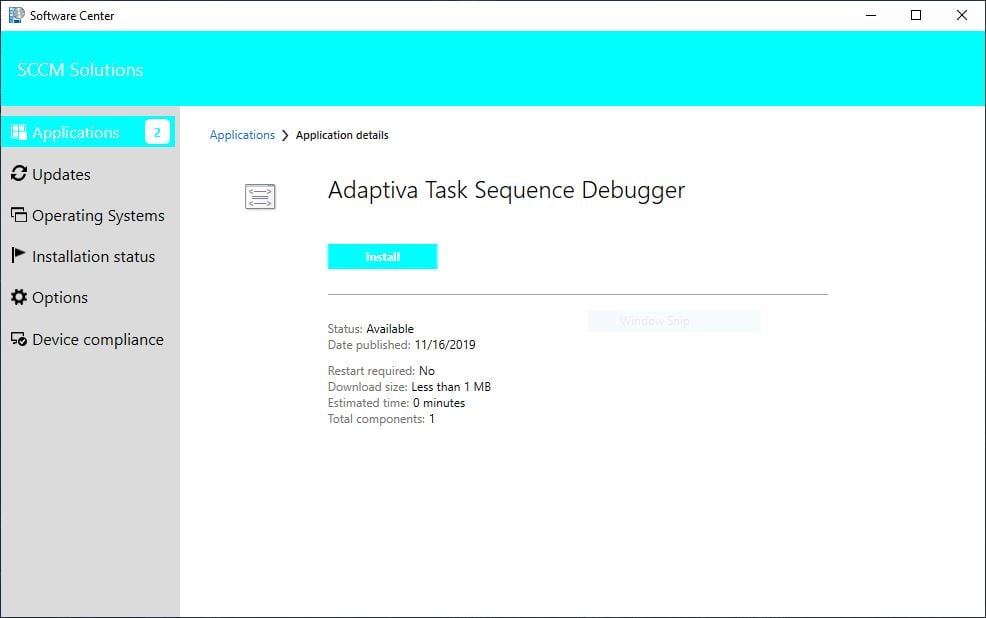
It’s only when you click Install that you notice something different and the Task Sequence Debugger kicks in. The top window has options for you to select and control the debug, whilst the bottom window gives you a handy break down of all the Task Sequence Variables used.
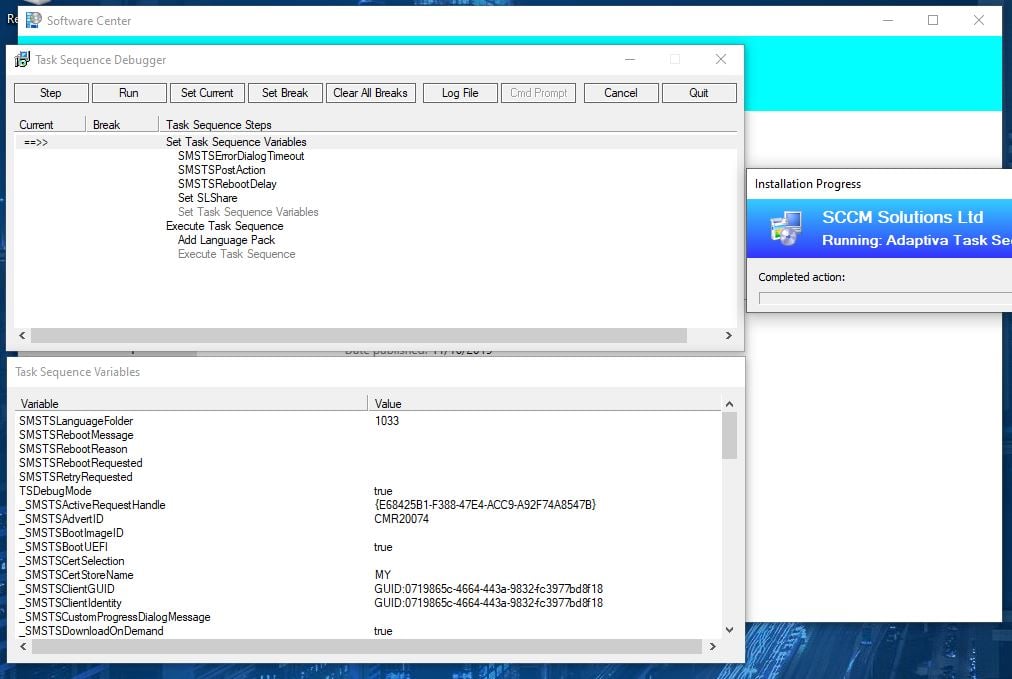
The task sequence doesn’t begin to run, but allows you set to set an action. You could, for example, enter a Set Break at a particular step. This will Stop the task sequence at that step.
Be aware if you use Set Break that they do not survive Restart Computer steps. The Task Sequence Debugger will pause the task sequence after a restart, however, allowing you to set the actions you require.
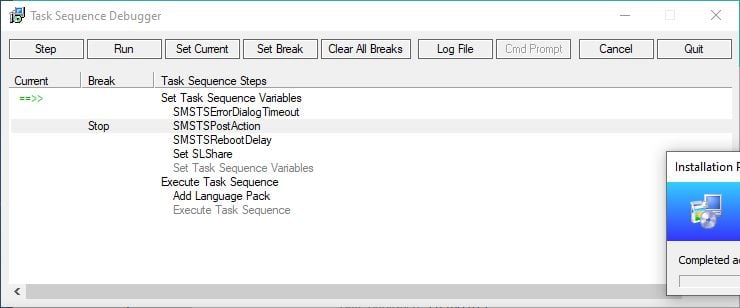
Note the ==>> in the Current column highlighting where you are in the task sequence.
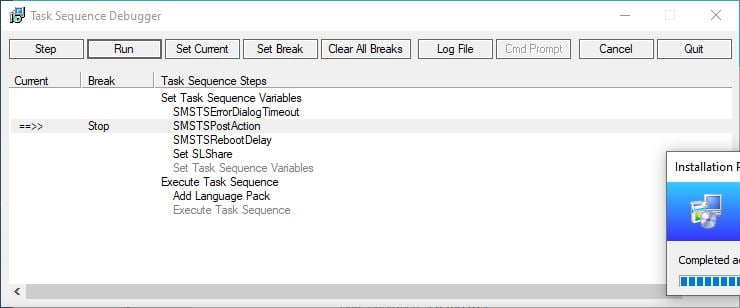
If you click the Step button, this will execute the highlighted step only, whereas clicking Run will continue to run the task sequence until you hit a break in the sequence.
A pretty cool feature is the ability to jump steps in the task sequence. Simply highlight the step you want to go to.
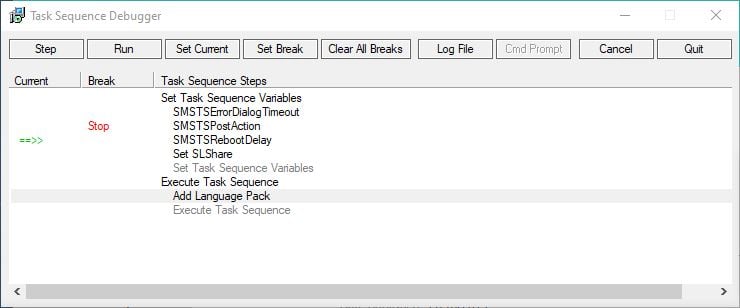
Then click Set Current.
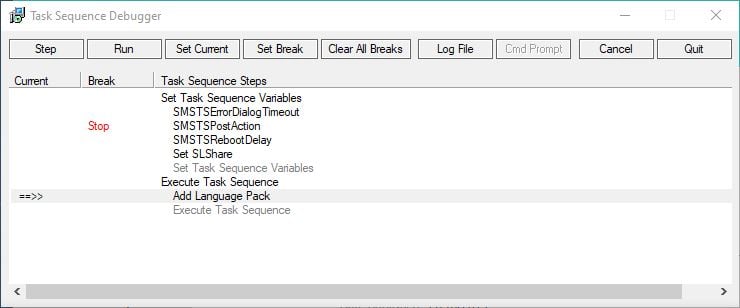
Your task sequence will hop straight to that point once you click Step or Run, handy if there is a particular step you wish to test. Note though, that jumping around in the task sequence can cause steps to fail. If running in the wrong mode (e.g. WinPE is expected when in full OS) or if pre-reqs steps or variables have not been populated prior to execution.
If something does fail in your build, you can attempt to remediate the problem. Closing the task sequence when it errors will not stop the task sequence from running. You can attempt remediation externally and re-run the step.
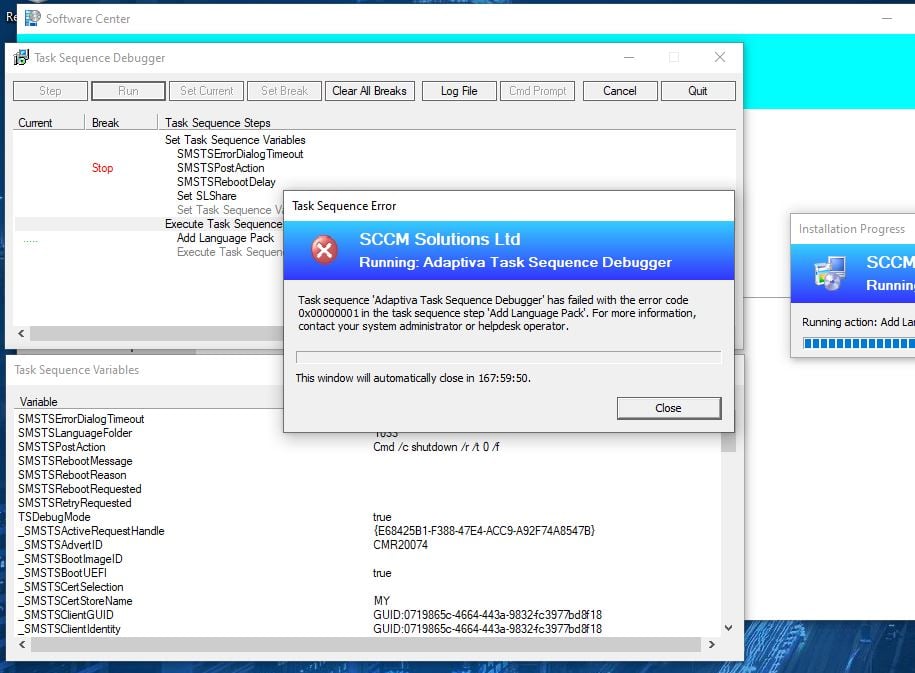
In my example task sequence, I had a Run Command Line step to insert a language pack onto my device. However, I had intentionally made a mistake in my command line to run the DISM command.
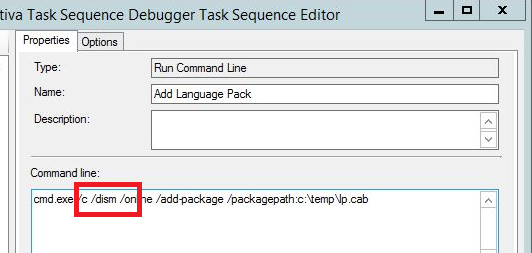
I decided to Quit from the Task Sequence Debugger tool. Instead, I decided to update policy on the device, get the updated task sequence, and used Set Current to go straight to the Add Language Pack step. At that point the command ran successfully.
You can click the Log File button to open CMTrace and check your SMSTS.log file.
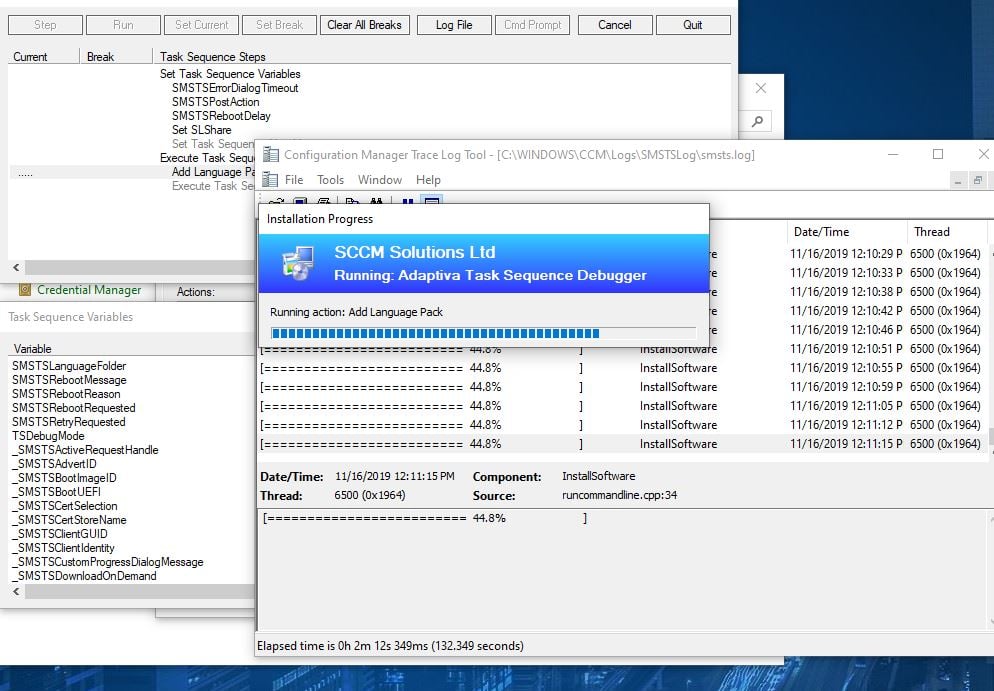
The Cancel and Quit buttons in the debugger have different actions.
Cancel will close the debugger tool and stop the execution of the task sequence, whilst Quit will close the debugger and allow the task sequence to continue execution.
This is such a cool new feature in ConfigMgr that is going to save hours and hours spent in testing and troubleshooting operating system deployment.


